The User Support Services Implementation schedule began with transitions into User Support Services by College of Design (on April 27), School of Journalism and Communication (on April 27), and College of Arts and Science (on May 18).
User Support Services is gathering and sharing the following metrics:
- Customer satisfaction scores for four questions, each using a 1 to 5 scale
- Time to respond data
During most of June, implementations were put on hold while we gathered data on the quality of support. The new team, USS Academic North, is comprised of IT professionals from College of Design, School of Journalism and Communication, and College of Arts and Science.
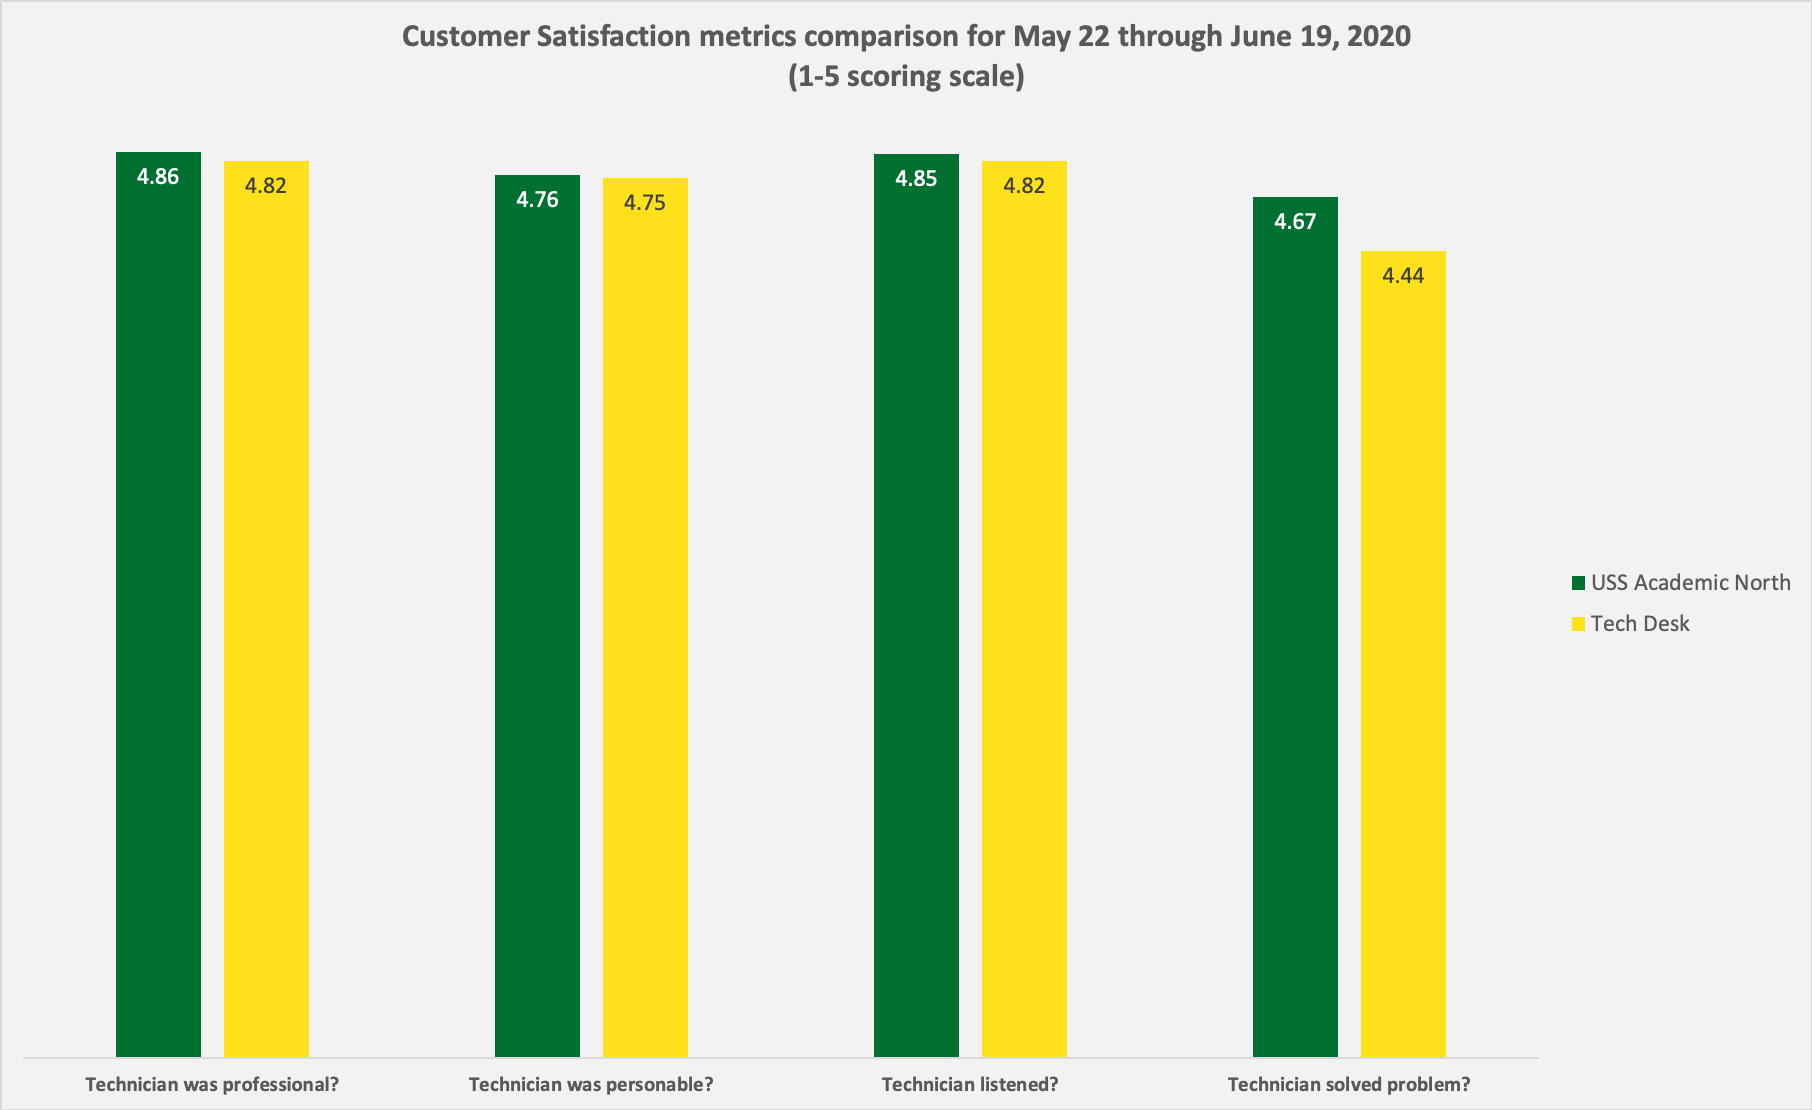
Customer Satisfaction
The chart below shows customer satisfaction scores for the new team and compares those scores with those from the Technology Service Desk (Tech Desk) for the same period.
Time to Respond
This measures the amount of time it takes, on average in hours, from when a customer creates a ticket to when they receive the first response.
| Team | Hours | Days | May, 2020 | June, 2020 |
| USS Academic North | 8am to 5pm | Mon-Fri | 7.1 | 7.24 |
| USS Tech Desk | 8am to 10pm | Mon-Sun | 3.26 | 1.8 |
Figures above are average of the absolute hours to first response for the period shown. Here, “absolute” means the clock starts when the ticket was created and ends when the initial responsible group first responds regardless of work hours. Teams with shorter hours of operation may see longer average times due to requests that arrive just past close of business.
More Data Available
Information Services will publish metrics monthly for User Support Services at User Support Services Metrics (UO Service Portal).
In the future, we aim to include first contact resolution (FCR) metrics. FCR is the measure of how often a question is answered on the first contact.